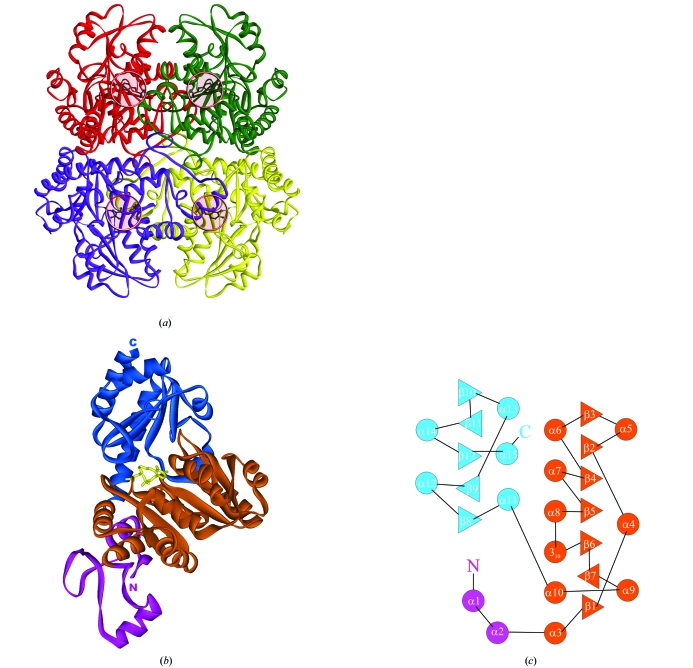
Figure 2.
(a) Schematic model of MGL tetramer. Subunits are shown in different colours. PLP-binding sites are shown by pink circles. (b) Schematic representation of a monomer. The N-terminal domain is shown in magenta, the PLP-binding domain is in orange and the C-terminal domain is in blue. PLP is shown in ball-and-stick representation. (c) Topology diagram of a monomer.

