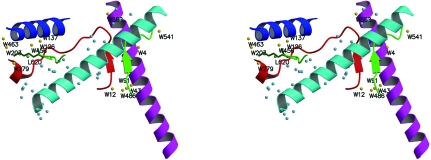
Figure 2.
Stereo image showing BS, MC and H42B interaction regions. The colour code is red for the H2A docking sequence; green for the H4′ docking sequence; blue for the H3′ αN helix; magenta for the H2B α2 helix; cyan for the α2 H3′ helix; gold for those waters associated with the docking sequences; sky blue for those waters involved in holding the α2 H3′ helix within the molecular cluster; lime green for chloride L620; dark green for Lys44 of H4′.

