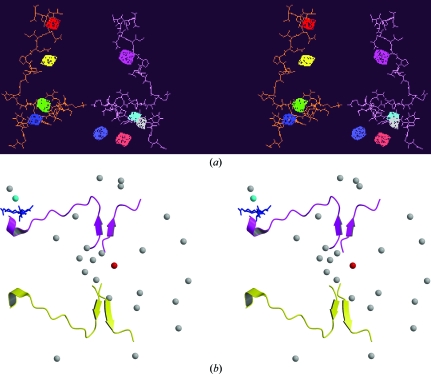
Figure 3.
Two stereo images of the binding site. The colour code for (a) is orange for the H2A–H4′ docking sequence; magenta for the H2A′–H4 docking sequence and assorted colours for the HO cavities identified by DEEPVIEW (Guex & Peitsch, 1997 ▶). The total volume for the cavities shown is 240 Å3. The colour code for (b) is magenta for the H2A′–H4 docking sequence and yellow for the H2A–H4′ sequence. Grey spheres are not waters, but the predicted core-histone and DNA-binding sites (Brady & Stouten, 2000 ▶). The binding sites have been superimposed onto a ribbon representation of the docking sequences. The red sphere is the top-ranked binding site and falls midway between the two docking regions. The cyan sphere is one of the predicted binding sites used to test the voracity of the predictions and correlates with the actual DNA-binding area shown in blue, which is comprised of residues Arg45, Ile46, Ser47 and Gly48 of H4′ (Chantalat et al., 2003 ▶). As a second test, predicted binding sites were regenerated without considering the solvent structure (data not shown). The predicted sites showed no correlation with known binding sites.

