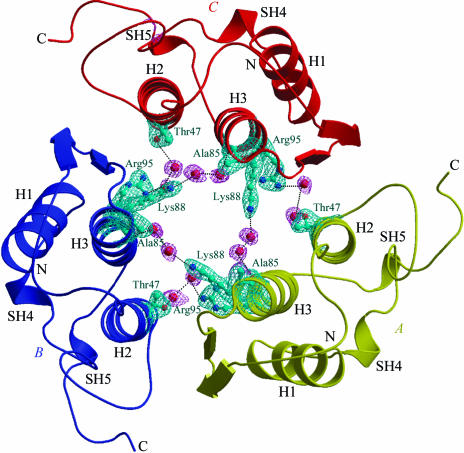
Figure 1.
The overall fold of the trimer, showing monomers A (yellow), B (blue) and C (red). The secondary-structure elements are also indicated. The difference (|F o − F c|) Fourier map drawn at 2.5σ cutoff was calculated by omitting the contents of the trimeric pore. The figure was produced with the help of the programs BOBSCRIPT (Esnouf, 1997 ▶) and RASTER3D (Merritt & Murphy, 1994 ▶).

