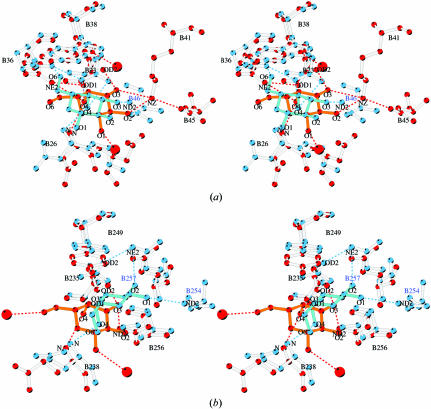
Figure 6.
(a) Stereo representation of the superposition of the galactose-binding site I of ML-I in red and ebulin in blue as a ball-and-stick model. The galactose molecule is coloured red–orange in ML-I and blue in ebulin. Accordingly, hydrogen bonds are shown as red dashed lines for the ML-I and in blue for the ebulin complex. Water molecules in the ML-I complex are marked as red circles. (b) Superposition of the galactose-binding site II of ML-I in red and of ebulin in blue; stereoview in ball-and-stick mode. The galactose molecule is coloured red–orange in ML-I and in blue in ebulin. Accordingly, the hydrogen bonds are shown as red dashed lines for the ML-I and in blue for the ebulin complex. Water molecules in the ML-I complex are indicated as red circles.

