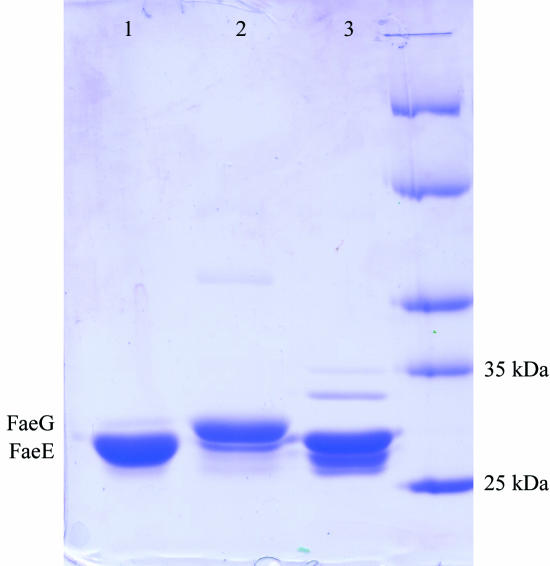
Figure 3.
SDS–PAGE analysis of the FaeE–FaeG crystallization. Lane 1, crystals grown in solutions initially containing the FaeE–FaeG complex, showing clearly that only FaeE is present. Lane 2, liquid remaining in the hanging drop after removal of the crystals, showing an excess of FaeG. Lane 3, control sample of purified FaeE.

