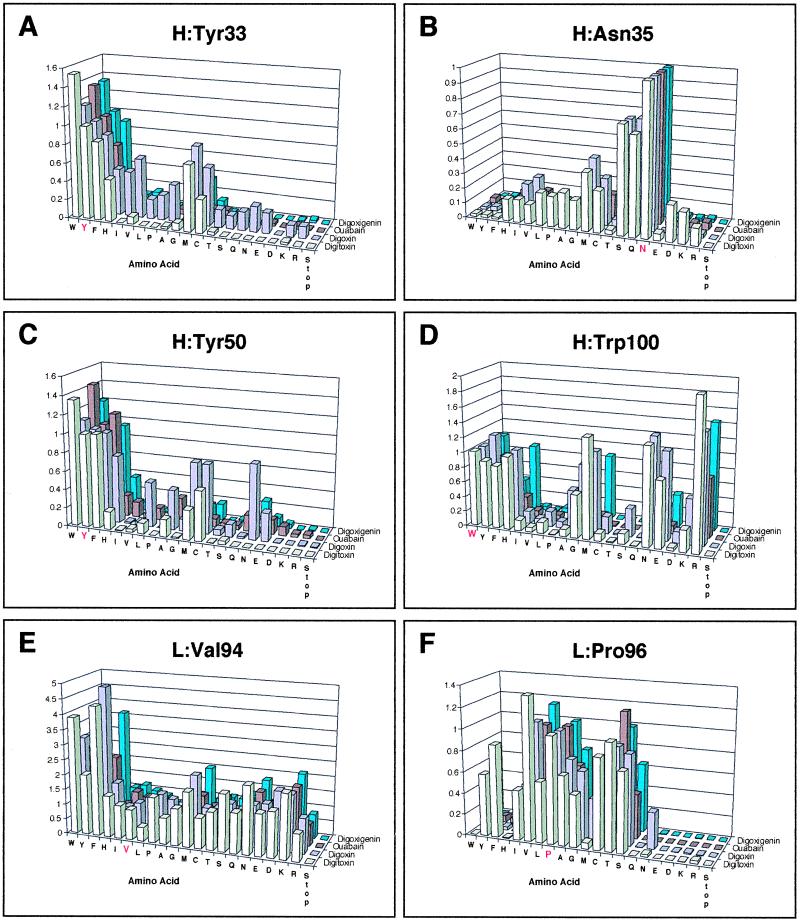
Figure 2.
Histograms of the ELISA data for the different mutant proteins binding to digoxin, digitoxin, digoxigenin, and ouabain. (A) Mutations of residue H:Tyr-33. (B) Mutations of residue H:Asn-35. (C) Mutations of residue H:Tyr-50. (D) Mutations of residue H:Trp-100. (E) Mutations of residue L:Val-94. (F) Mutations of residue L:Pro-96. The plotted values correspond to the absorbance observed in ELISA measured at 405 nm on a microplate autoreader when the ABTS reaction was still in the linear range, a fact that was confirmed by taking several time points per plate. For each cardiac glycoside being investigated (digoxin, digitoxin, digoxigenin, ouabain) the absorbances for each mutant were linearly scaled to that of the wild-type scFv(Dig), which was assigned a value of 1.0, then plotted in the histograms. Wild-type scFv(Dig) was included on every ELISA plate to provide an internal calibration of the data.

