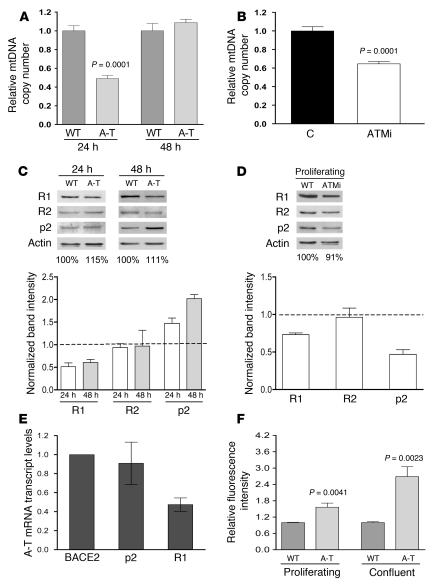
Figure 3. ATM is required for mtDNA maintenance and normal expression of RR subunits in the absence of DNA damage.
(A) Relative mtDNA copy number (plotted as in Figure 1) of wild-type and A-T primary fibroblasts at 24 or 48 hours. The mean ± SEM is plotted with significant statistical differences via Student’s t test indicated. (B) Relative mtDNA copy number of wild-type primary fibroblasts untreated (C) or treated for 24 hours with indicated concentration of ATM inhibitor KU-55933, after a 48-hour preincubation. The mean ± SEM is plotted with significant statistical differences via Student’s t test indicated. (C) Western blot analysis of R1, R2, and p53R2 (p2) of wild-type and A-T primary fibroblasts at 24 and 48 hours from a representative blot corresponding to conditions in A as depicted in Figure 2D. (D) Western blot analysis of R1, R2, and p53R2 of wild-type primary fibroblasts treated with 10 μM ATM inhibitor KU-55933 (ATMi) as described in B and depicted as in Figure 2D. (E) Relative levels of BACE2-normalized R1 and p53R2 mRNA transcript levels in A-T patient–derived fibroblasts. The mean ± SEM from 3 independent experiments is plotted. (F) Relative fluorescence intensity of dihydroethidium, a dye that detects cellular ROS, in wild-type and A-T primary fibroblasts at 24 hours (proliferating) or 6 days (confluent) with wild-type fluorescence arbitrarily set to 1.0 at each time point. The mean ± SEM of 1 representative experiment is plotted with significant statistical differences via Student’s t test indicated.

