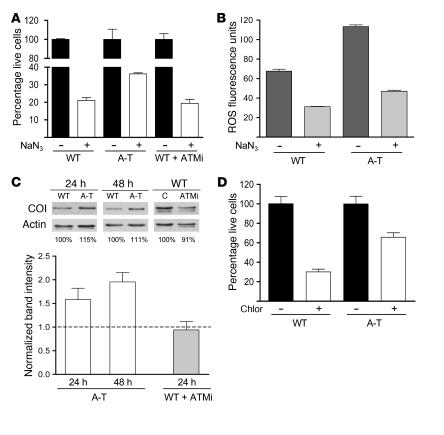
Figure 6. A-T patient–derived fibroblasts exhibit aberrant resistance to mitochondrial inhibitors and abnormal mtDNA-encoded CO I levels.
(A) Relative cell number with respect to untreated controls of wild-type, A-T, or ATM-inhibited wild-type cells (ATMi), treated with 8 mM sodium azide (NaN3) for 4 days. The percentage of live cells compared with untreated controls is plotted on the y axis with genotype and treatment on the x axis. The mean ± SEM of 1 representative experiment is shown. (B) Relative fluorescence intensity of dihydroethidium in wild-type and A-T primary fibroblasts at 40 hours of 8 mM NaN3 treatment. The mean ± SEM of 1 representative experiment is plotted. (C) Western blot analysis of mtDNA-encoded CO I for wild-type, A-T, and ATM-inhibited wild-type fibroblasts as described in Figure 2D. (D) Relative cell number with respect to untreated controls of wild-type and A-T cells treated with 240 μg/ml of mitochondrial translation inhibitor chloramphenicol (Chlor) for 4 days. The percentage of live cells compared with untreated controls is plotted on the y axis with genotype and treatment on the x axis. The mean ± SEM of 2 independent experiments is shown.

