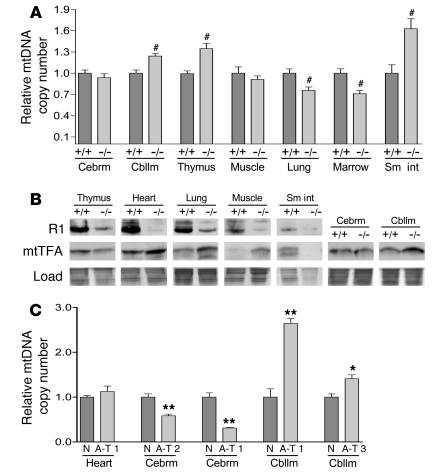
Figure 7. ATM null tissues exhibit loss of mtDNA homeostasis and depleted levels of RR subunit R1.
(A) Relative mtDNA copy number of wild-type (+/+) and ATM null (–/–) mouse tissues plotted as in Figure 1, with the mean of each wild-type tissue arbitrarily set to 1.0. The mean ± SEM is plotted with significant statistical differences via Student’s t test indicated (#P < 0.03). (B) Western blot of R1 and mtTFA in wild-type (+/+) and ATM null (–/–) mouse tissues. Simply Blue gel staining demonstrates loading. (C) Relative mtDNA copy number of normal or A-T patient tissues plotted as in Figure 1, with the mean of the normal control tissue (N) arbitrarily set to 1.0. The mean ± SEM is plotted with significant statistical differences via Student’s t test indicated (*P < 0.01, **P < 0.001). Cebrm, cerebrum; Cbllm, cerebellum; Sm int, small intestine.

