
Figure 6.
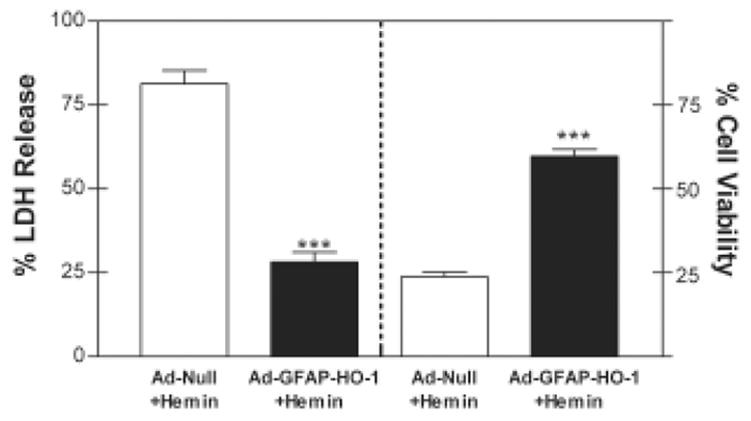
Quantification of the protective effect of Ad-GFAP-HO-1. Mean culture percentage LDH release (left axis) and percentage cell viability (right axis) as assessed by MTT assay (± SEM, n = 7–10/condition), 24 hours after treatment with 10 μM hemin, preceded by 24 hour treatment with 100 MOI Ad-GFAP-HO-1 or 100 MOI control Ad-Null. ***P < 0.001, unpaired two-tailed t test.