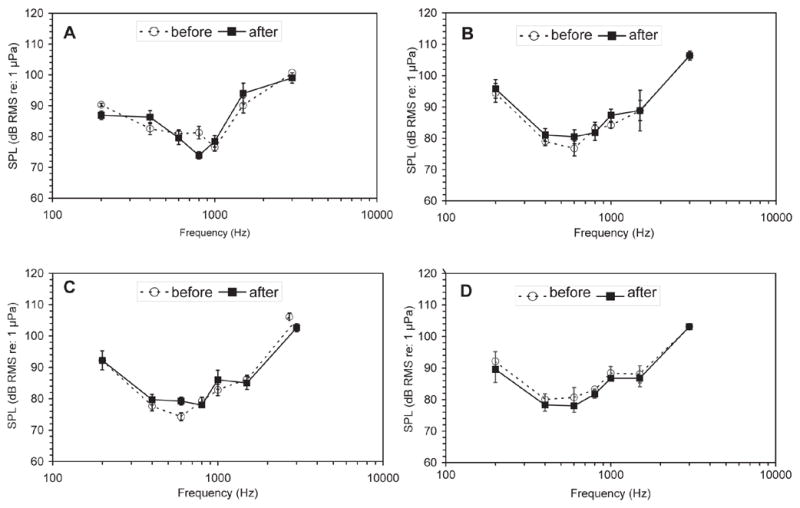
Figure 3.

Mean audiograms for all Fentanyl dosage groups. In all panels, the mean thresholds prior to Fentanyl administration are plotted as open circles and dashed lines and the thresholds measured following Fentanyl administration are plotted as squares and solid lines. Error bars depict one standard error (n=4). (A) 0 ug g−1, (B) 100 μg g−1 (C), 500 μg g−1 (D) and 2500 μg g−1 Fentanyl.
