
FIGURE 2.
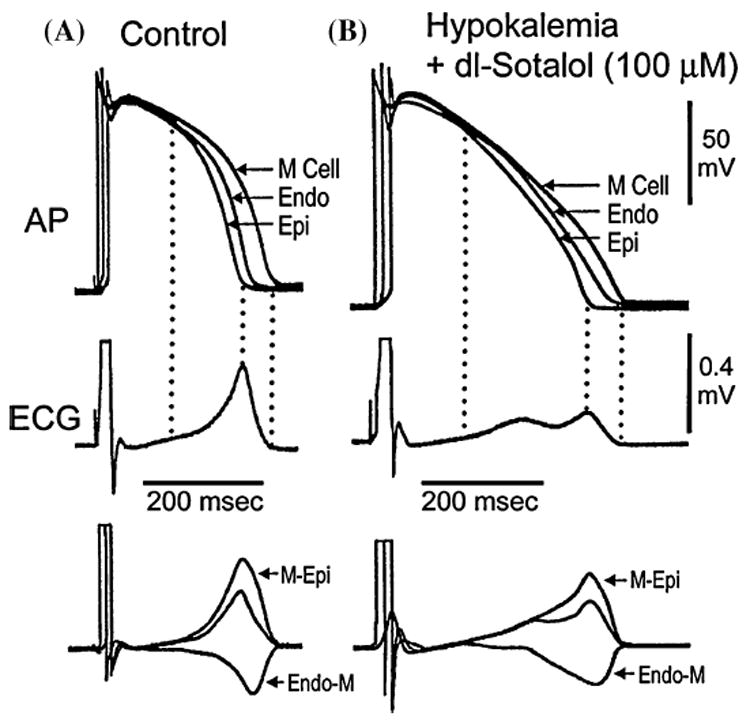
Voltage gradients on either side of the M region and the inscription of the T wave. Top: Action potentials simultaneously recorded from endocardial, epicardial, and M region sites of an arterially perfused canine left ventricular wedge preparation. Middle: ECG recorded across the wedge. Bottom: Computed voltage differences between the M-Epi action potentials (ΔVM–Epi) and between the M region and endocardium responses (ΔVEndo–M). If these traces are representative of the opposing voltage gradients on either side of the M region, responsible for inscription of the T wave, then the weighted sum of the two traces should yield a trace (middle trace in bottom grouping) resembling the ECG, which it does. (A): Control. (B): Hypokalemic conditions ([K+]o = 1.5 mM) + dl-sotalol (100 uM). Basic cycle length (BCL) = 1,000 msec. (Modified from Ref. 32 with permission.)