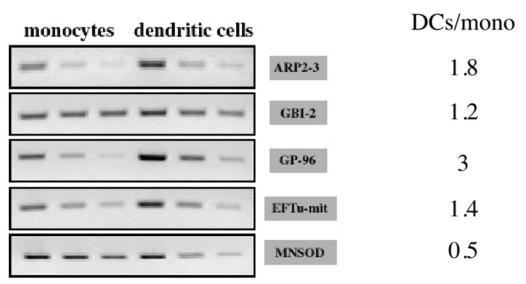
Figure 3.

Semi-quantitative analysis of the expression of some genes coding for proteins detected by proteomics. RNA was extracted from monocytes and monocyte-derived DCs. RNA was reverse transcribed and cDNAs, corresponding to 7 ng, 20 ng and 100 ng (MnSOD, EFTu, ARP2–3 GP96, GBI-2), were amplified with gene specific oligonucleotides. PCR products were analyzed on 2% agarose gels. For each gene, the abundance ratio (DC/monocyte) was calculated by densitometry of the RT-PCR products.
