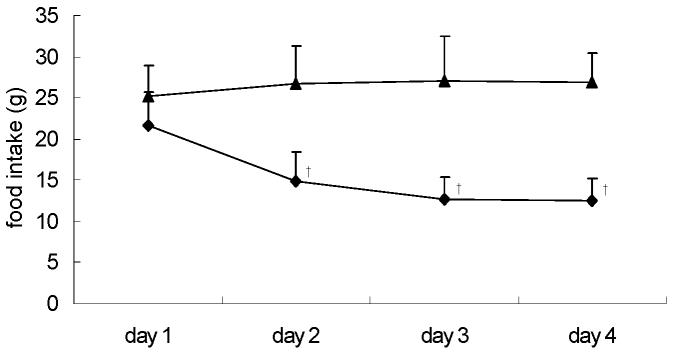
Figure 1.
Daily food intake during the last 4 days of treatment, for control (CON) (▲) and dexamethasone (DEX)-treated (◆) rats. For details of procedure see Materials and methods section. Values expressed as the mean for eight rats per group (standard deviation denoted by vertical bars). Significant differences indicated: † P < 0.01 vs. CON.

