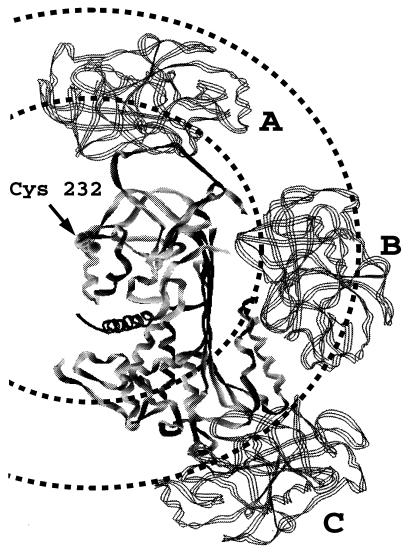
Figure 5.
Models of noncovalent and covalent serpin–proteinase complexes. The serpin (solid ribbon) is shown in the center in an orientation such that the reactive center loop in the unreacted molecule is at the top of the molecule and β-sheet A is seen edge-on, running from top to bottom. The F helix is on the surface of β-sheet A at the bottom right side (distal end of β-sheet from the reactive center). The serpin shown is antithrombin in its crystal structure conformation that has an appropriate exposed and extended reactive center loop for initial noncovalent docking with proteinase. However, the structural homology between serpins is such that the location indicated for the Cys-232 residue is equivalent to that in α1-proteinase inhibitor. The proteinase (three-stranded ribbon) is shown in three different locations corresponding to three distinct types of complex. Two circles are drawn, centered on the position of Cys-232 in α1-proteinase inhibitor Pittsburgh, with radii of 35 Å and 56 Å, corresponding to the interfluorophore separations measured for the noncovalent and covalent serpin–proteinase complexes, respectively. Structure A (proteinase at top) represents the noncovalent complex of the anhydroproteinase or of the active proteinase in the initial Michaelis-like complex. Structure B (proteinase in the middle) represents a covalent partially loop-inserted (up to P9) covalent complex. Note the abutment of the proteinase against the F α-helix. Structure C (proteinase at the bottom), represents a covalent complex in which the reactive center loop has completely inserted into β-sheet A and has resulted in translocation of the proteinase from the proximal (top) end of the serpin to the distal (bottom) end.

