Figure 1.
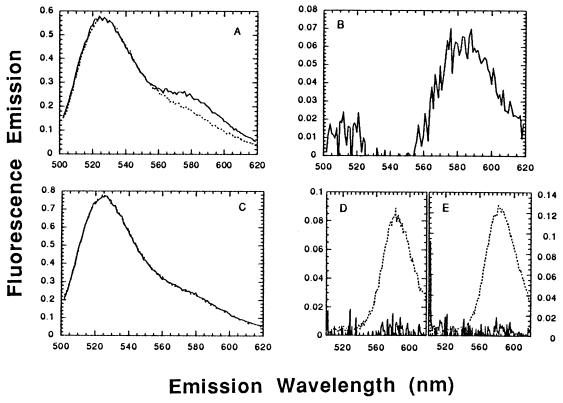
Homologous pairing assayed by FRET. (A) Pairing of homologous single-stranded and duplex oligonucleotides, 3′-F-A16(−) with 5′-R-A16(+)/A16(−). The dotted line represents the summed emission spectra for a reaction lacking a rhodamine-labeled strand and for a reaction lacking a fluorescein-labeled strand, after excitation at 493 nm. The solid line represents the spectrum of the complete reaction mixture containing DNA conjugated with both dyes. (B) Difference spectrum derived from A: the sensitized emission from rhodamine—i.e., the net enhancement in rhodamine emission as a consequence of energy transfer, from which the background of nonsensitized emission has been subtracted. Since the sensitized and nonsensitized emission in this experiment were of equal magnitude, the net emission from rhodamine increased 100% as a result of energy transfer. (C) Heterologous DNA, 3′-F-X16 plus 5′-R-A16(+)/A16(−), otherwise as in A. The superposition of the two curves means that there was no detectable FRET. (D) Difference spectrum derived from C. The solid line represents a FRET signal that is negligible compared with the nonsensitized emission from rhodamine, shown for comparison by the dotted line. (E) Difference spectrum for a reaction of the homologous substrates shown in A, in the presence of ATP[γS]. As in D, the solid line represents a FRET signal that is negligible compared with the nonsensitized emission from rhodamine, shown for comparison by the dotted line.

