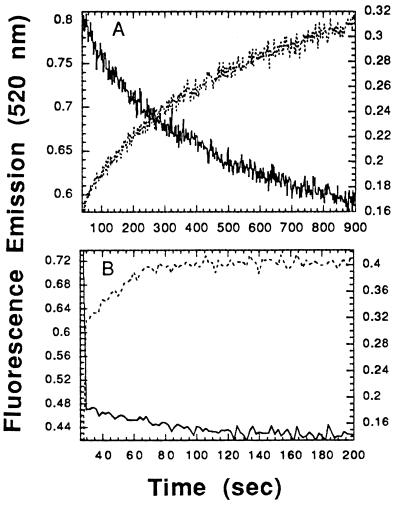
Figure 3.
Time courses of homologous pairing and strand exchange. (A) HsRad51. (B) RecA. Pairing and strand exchange were measured by two FRET assays with different respective locations of the fluorescent probes in the substrates (see Materials and Methods). Solid lines are plots of quenching of fluorescence from fluorescein as a result of homologous pairing; dotted lines are plots of enhancement of fluorescence as a result of strand exchange. The intensity of fluorescein emission was observed at 520 nm upon excitation at 493 nm.

