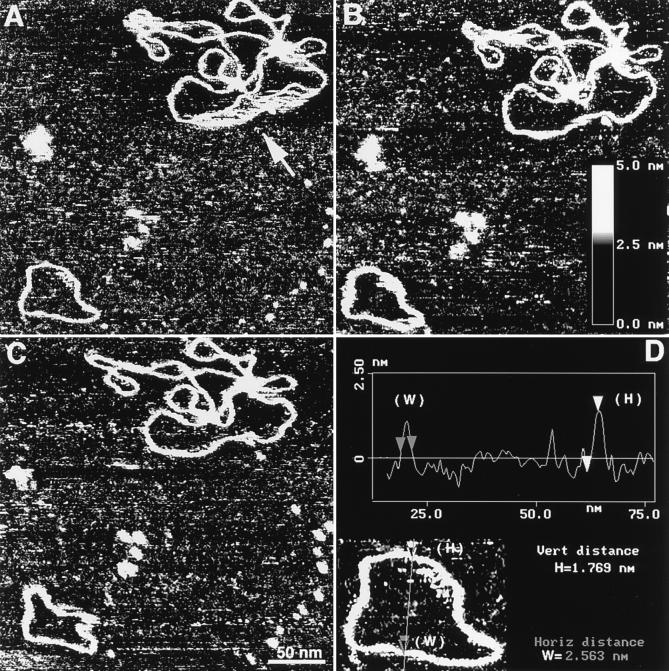
Figure 3.
DNA motion during scanning (A–C). AFM images in TE buffer over a 300 × 300 nm area. The images in A–C were taken with an interval of 4.5 min. The section of the plasmid DNA that was in motion during scanning of the image in A is indicated with an arrow. Z-range for all the images is indicated by the Inset in Fig. 3B. D illustrates the procedure for measurements width (W) and height (H) of DNA by a cross-section option of the NanoScope III software. The data were obtained for the mini circle shown in Fig. 3A. The measurements were done for the part of the molecule that was stable during scanning.

