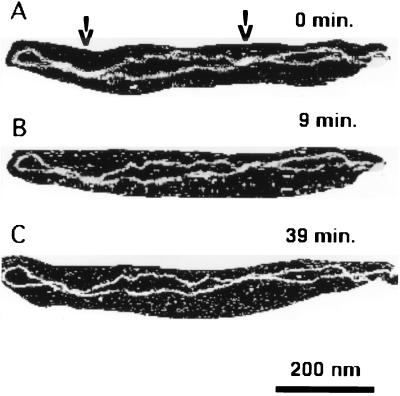
Figure 4.
AFM images of an individual DNA molecule, demonstrating segmental movement of the molecule at the solid–liquid interface. The images were taken in TE buffer with 80 mM NaCl. The images in B and C were taken 9 and 39 min, respectively, after the image in A was recorded. The regions of close DNA–DNA contacts are indicated with arrows.

