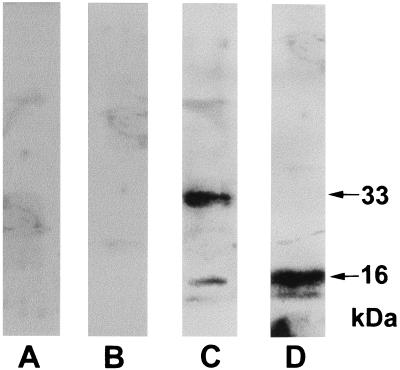
Figure 4.
Western blot analysis of cytosolic and nuclear protein extracts from control and IL-1α33-transfected cells. [Lanes A (cytosolic) and B (nuclear)] Extracts from control MC. [Lanes C (cytosolic) and D (nuclear)] Extracts from IL-1α33 transfectants. Arrows denote the 33- and 16-kDa IL-1α segments.

