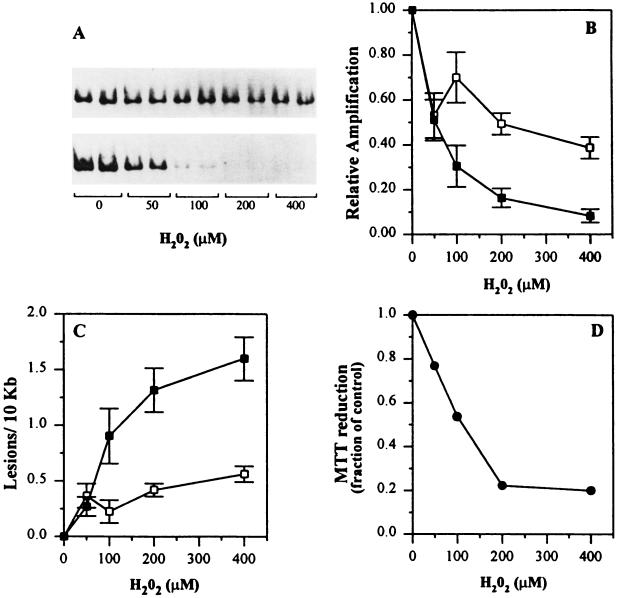
Figure 2.
H2O2 dose response in human fibroblast cells. Human fibroblast cells were exposed to increasing concentrations of H2O2, in duplicate plates for each dose, for 1 hr at 37°C, and total cellular DNA was isolated. Control cultures were incubated in serum-free medium alone. (A) Representative autoradiogram depicting the decrease in amplification of the 17.7-kb β-globin fragment (Upper) and the 16.2-kb mitochondrial fragment (Lower). (B) The amount of radioactivity associated with each amplification product relative to the nondamaged controls was determined by PhosphorImager (Molecular Dynamics) analysis and is plotted as a function of H2O2 concentration: (▪), 16.2-kb mitochondrial fragment; (□), 17.7-kb β-globin fragment. (C) The decrease in relative amplification from B was then converted to lesion frequency using the Poisson equation as described. The data are expressed as the mean ± SEM from a minimum of two biological experiments in which 3–5 PCRs were performed per experiment. Statistically significant differences in the lesion frequency for both fragments at each dose were calculated using the unpaired Student’s t test (100 μM, P = 0.05; 200 μM, P = 0.004; 400 μM, P = 0.0001). (D) Mitochondrial function assayed by MTT reduction. Fibroblast cells were plated in 60-mm dishes and exposed to increasing concentrations of H2O2 for 60 min at 37°C. Following H2O2 exposure, the cells were rinsed with PBS and incubated for 60 min with conditioned medium containing 2.0 μg/ml MTT. Afterward the medium was removed, the cells lysed, and the absorbance measured at 570 nm (•). MTT reduction was determined with a standard curve and normalized to nontreated controls and is reported as a fraction of control. The data are expressed as the mean ± SD for triplicate plates (error bars were omitted because the SD were <1%).

