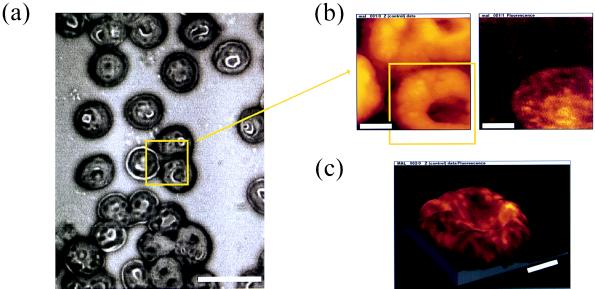
Figure 1.
Mapping of malarial protein in the erythrocyte membrane. A thin blood smear of the trophozoite infected erythrocytes was fixed, then reacted with antibodies against PfHRP1, and labeled with tetramethylrhodamine. (a) Bright-field image of the blood smear. The NSOM tip was positioned above the three cells in the center of the field-of-view and a scan was taken within the yellow framed area. (Scale bar = 10 μm.) (b) Result of the NSOM imaging in topography (Left) and fluorescence (Right) (128 × 128 pixels, 60 nm/pixel). While all three cells are imaged in topography, only the one in the lower right corner was infected and is visible in the fluorescence image. (c) Zoom around the infected cell, which was seen in the lower right corner of b (128 × 128 pixels, 52 nm/pixel). The fluorescence signal is superimposed as a color value (brightness scale goes from black via red to yellow) to the topography to show the distribution of PfHRP1 in the erythrocyte membrane. (Scale bar for b and c = 2 μm.) Z range for c is 1 μm.

