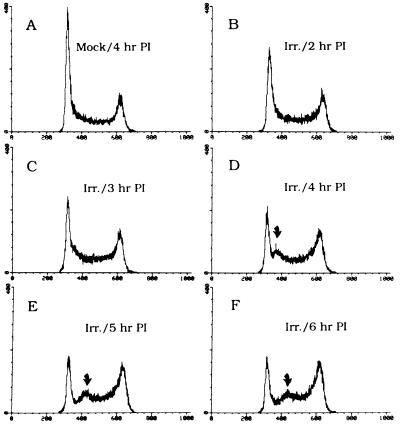
Figure 3.
FACS analysis of asynchronous CHOC 400 cells after a radiation challenge. Asynchronous CHOC 400 cells were irradiated with 10 Gy, and samples were taken 2, 3, 4, 5, and 6 hr later for FACS analysis as previously described, using propidium iodide (PI) to stain the DNA (17). A is the mock-irradiated control sampled 4 hr after irradiation of the other samples. Arrows indicate the peak of synchronized cells discussed in the text.

