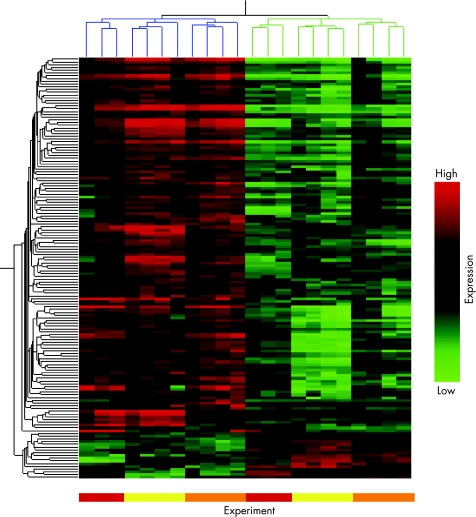
Figure 1 Hierarchical clustering of HUVEC genes changed twofold or more in expression (p<0.05) by treatment with anti‐β2GPI antibodies. In three independent experiments on different HUVEC preparations, cells were incubated for 4 h with either anti‐β2GPI antibodies (P1, P2, P3, P4, 50 μg/ml) or normal control IgG (N1, N2, N3, N4, 50 μg/ml). mRNA was isolated and processed for microarray hybridisation and analysis. A genetree and condition tree were created in GeneSpring software by average linkage hierarchical clustering using the Pearson Correlation. Each column represents results from an individual microarray chip (n = 22), each horizontal row represents a gene. Genes have been clustered according to similarities in patterns of expression (vertical axis) as well as per condition (horizontal axis). Branches are colour‐coded for anti‐β2GPI antibody treated (blue) and control IgG (green) treated samples. Coloured bars below figure also indicate location of results from the three independent experiments. Differences in expression level between anti‐β2GPI antibody treated HUVEC and those incubated with normal control IgG are clearly distinguishable on the heat map. Genes with high expression levels are in red, intermediate‐level expression in black and low‐level expression in green.

An official website of the United States government
Here's how you know
Official websites use .gov
A
.gov website belongs to an official
government organization in the United States.
Secure .gov websites use HTTPS
A lock (
) or https:// means you've safely
connected to the .gov website. Share sensitive
information only on official, secure websites.
