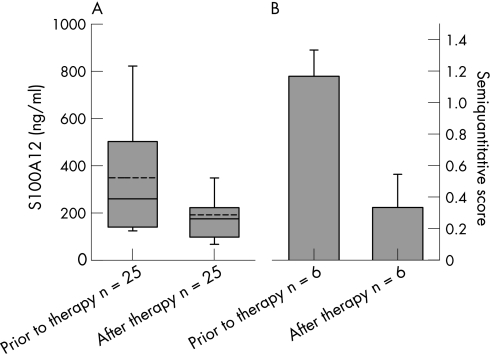
Figure 1 (A) S100A12 serum levels (p = 0.001) and (B) S100A12 synovial sublining layer expression (p = 0.025) in patients who responded to infliximab treatment, before and after therapy. In contrast, S100A12 serum levels and S100A12 synovial sublining layer expression revealed no significant differences (p = 0.02 for both) in patients who did not respond to infliximab treatment (not shown). S100A12 serum levels are expressed as boxplots with median, 10th, 25th, 75th, 90th percentile and mean line (dashed line) and S100A12 synovial sublining layer expression as semiquantitative microscopic score. Mean ± SEM.

An official website of the United States government
Here's how you know
Official websites use .gov
A
.gov website belongs to an official
government organization in the United States.
Secure .gov websites use HTTPS
A lock (
) or https:// means you've safely
connected to the .gov website. Share sensitive
information only on official, secure websites.
