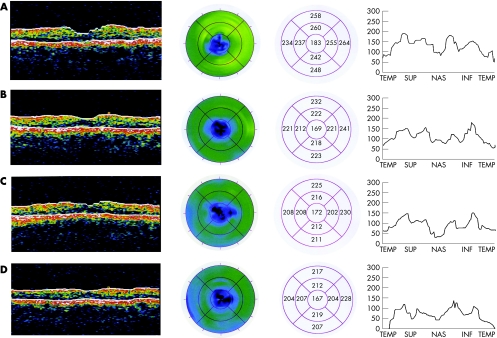
Figure 1 Optical coherence tomography scans on days 7 (A), 28 (B), 49 (C) and 77 (D) after injury. There is progressive thinning of the macular thickness as shown by the (left) color‐coded map, by (left circle) the color‐coded circle and by (right circle) the mean macular thickness measurements. There is also progressive loss of peripapillary nerve fibers as shown by the (right) retinal nerve fiber layer thickness profile.

An official website of the United States government
Here's how you know
Official websites use .gov
A
.gov website belongs to an official
government organization in the United States.
Secure .gov websites use HTTPS
A lock (
) or https:// means you've safely
connected to the .gov website. Share sensitive
information only on official, secure websites.
