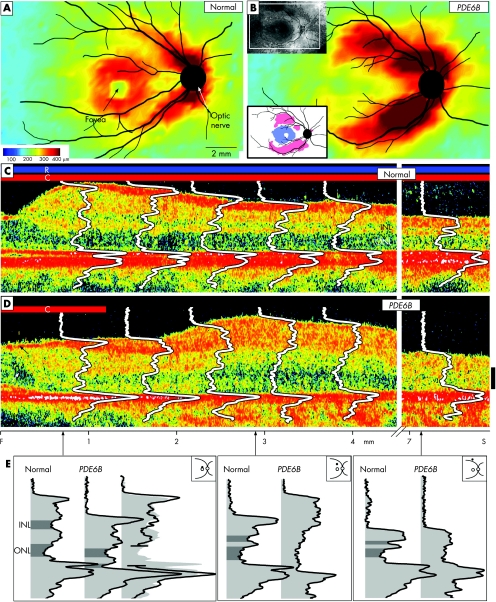
Figure 1 (A,B) Retinal topography in a normal subject (26 years of age) and in a patient with retinitis pigmentosa with PDE6B mutations (34 years of age). Insets in (B): upper left, fundus view and window where optical coherence tomography (OCT) mapping was performed; lower left, difference map from normal thickness (n = 5, ages 21–26 years). White represents within normal limits (±2SD); blue represents below and pink above normal limits. Fundus landmarks of the optic nerve and major retinal vessels are drawn on the maps. Cross‐sectional OCT images with overlaid longitudinal reflectivity profiles (LRPs) from the fovea into the superior retina of a normal subject (C; aged 28 years) and of the patient (D; arrows points to cystoid oedema, which was also evident on ophthalmoscopy, and epiretinal membrane). Bars above the cross‐sections indicate presence or absence of rod (R) and cone (C) function, measured by dark‐adapted perimetry. The patient has no rod function and detectable cone function in the central field only. Calibration bar at right: 100 μm. (E) Reflectivity profiles from three loci (0.7, 2.9 and 7.5 mm superior) to illustrate the differences between the patient's laminae and those of the normal subject. At the 0.7 mm locus, the patient profile is split and the two parts overlaid on the representative normal profile (third profile at the right in this subpanel). This is to test the hypothesis that lost photoreceptor components explain the thinness of the retina. At 2.9 and 7.5 mm superior loci, the abnormal lamination in the patient profile precludes testing the hypothesis about missing components. F, fovea; INL, inner nuclear layer; ONL, outer nuclear layer; S, superior.

An official website of the United States government
Here's how you know
Official websites use .gov
A
.gov website belongs to an official
government organization in the United States.
Secure .gov websites use HTTPS
A lock (
) or https:// means you've safely
connected to the .gov website. Share sensitive
information only on official, secure websites.
