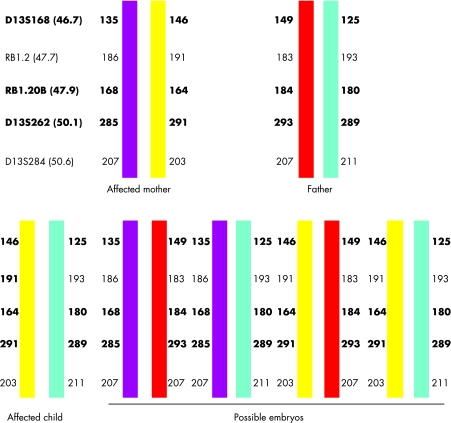
Figure 1 Haplotype diagram of the family showing the allele sizes for each of the markers tested. The chromosome depicted in yellow carried the mutation as it was the one shared between the affected proband and her affected child. Using this information it was possible to predict from the haplotype which embryos carried the RB1 mutation. The markers shown in bold were used for PGD. The position of each of the markers on chromosome 13, in Mb, is given in parentheses.

An official website of the United States government
Here's how you know
Official websites use .gov
A
.gov website belongs to an official
government organization in the United States.
Secure .gov websites use HTTPS
A lock (
) or https:// means you've safely
connected to the .gov website. Share sensitive
information only on official, secure websites.
