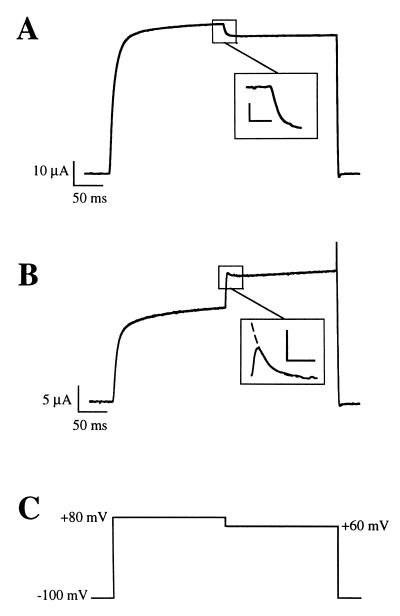
Figure 2.
Representative traces of the effect of a voltage step from +80 to +60 mV before (A) and 1 h after the application of 5 μg/ml progesterone (B). For these experiments, oocytes were held at −100 mV and the current was elicited by a depolarization to +80 mV. After 200 ms, the voltage was stepped to +60 mV, as depicted by the voltage template in C. The Inset of B shows the extrapolation to time 0 of the −20 mV step. The scale bars in the insets represent 2 μA and 10 ms (A) and 500 nA and 10 ms (B).

