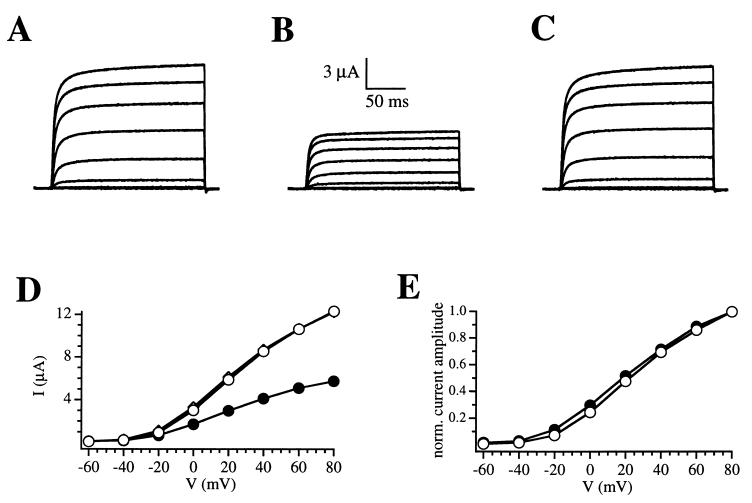
Figure 3.
Effect of caffeine-induced calcium release on R-eag current amplitude. (A) Control traces. During the application of 10 mM caffeine (B), the current is reduced at all voltages. After washout (C), the amplitude readily recovers and remains stable for the rest of the experiment. (D) I–V relationships corresponding to control traces (open circles), 10 mM caffeine (solid circles), and washout of the drug (diamonds). The data correspond to A, B, and C, respectively. The washout I–V plot is virtually overlapping the control oneplot. (E) I–V plots from D (records A and B) have been scaled to show that the current amplitude is homogeneously reduced throughout the voltage axis by the action of caffeine (symbols are as in D).

