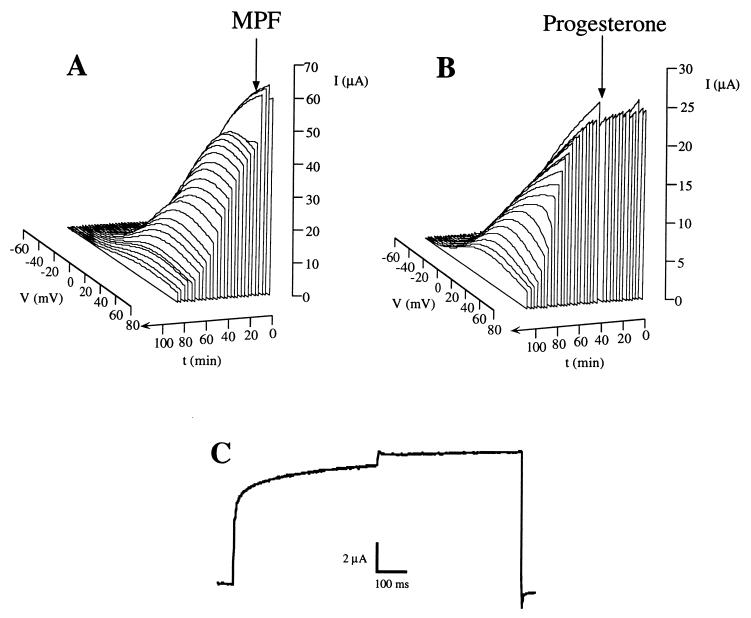
Figure 5.
Representation of the time course of the currents after the injection of MPF (A) and the application of progesterone (20 μg/ml) (B). The arrows indicate the time of injection or application. Note that for clarity, the time axis has been depicted such that it increaseds toward the front of the figure. (C) Initial effect produced by MPF injection, in an experiment identical to those depicted in Fig. 2 for progesterone treatment.

