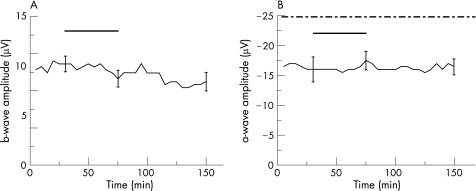
Figure 4 Effects of the vehicle on the a‐ and b‐wave amplitude of the isolated perfused bovine retina. The average of representative drug series (both test series, n = 5). After reaching equilibrium at stable ERG amplitudes, the vehicle without the substance rt‐PA was added to the nutrient solution. The black horizontal bar labels the time of the vehicle application. The dash‐dotted line in B marks the time of the additional aspartate application (1 mM). After 45 min, the exposure with the vehicle was discontinued and the perfusion with the nutrient solution resumed. The ERG amplitudes remained stable throughout the washout. Three representative standard deviations are given.

An official website of the United States government
Here's how you know
Official websites use .gov
A
.gov website belongs to an official
government organization in the United States.
Secure .gov websites use HTTPS
A lock (
) or https:// means you've safely
connected to the .gov website. Share sensitive
information only on official, secure websites.
