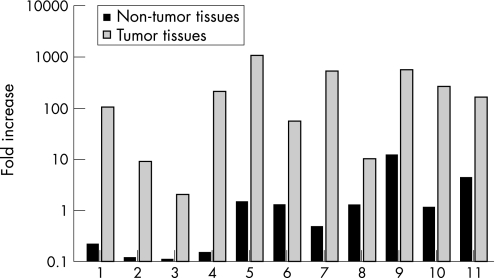
Figure 1 Relative quantitation of osteopontin (OPN) in gastric cancer tissues and neighbouring non‐tumour tissues. Expression differences were obtained for samples of 11 gastric cancer tissues and neighbouring non‐tumour tissues using paired Student's t‐test on log‐transformed values (p<0.0001). Each value is expressed as the mean of duplicate assays.

An official website of the United States government
Here's how you know
Official websites use .gov
A
.gov website belongs to an official
government organization in the United States.
Secure .gov websites use HTTPS
A lock (
) or https:// means you've safely
connected to the .gov website. Share sensitive
information only on official, secure websites.
