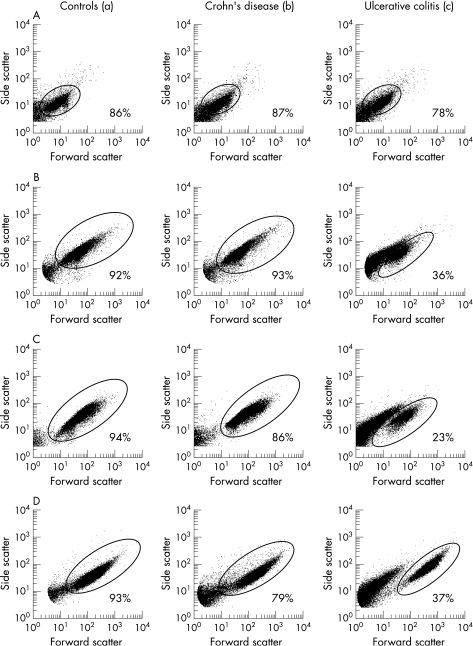
Figure 5 Forward scatter‐side scatter‐dot plot of B. vulgatus 484 B (A), E. coli ATCC 25922 (B), E. faecalis 199 (C) and S. aureus ATCC 25923 (D) after treatment with cationic extracts from biopsies of controls (a), patients with Crohn's disease (b) and ulcerative colitis (c). After incubation with extracts of ulcerative colitis, in suspensions of E. coli, E. faecalis and S. aureus 50–70% of the bacteria showed a lower forward and side scatter. Bacteria corresponding to the original population are given in percentages of the total.

An official website of the United States government
Here's how you know
Official websites use .gov
A
.gov website belongs to an official
government organization in the United States.
Secure .gov websites use HTTPS
A lock (
) or https:// means you've safely
connected to the .gov website. Share sensitive
information only on official, secure websites.
