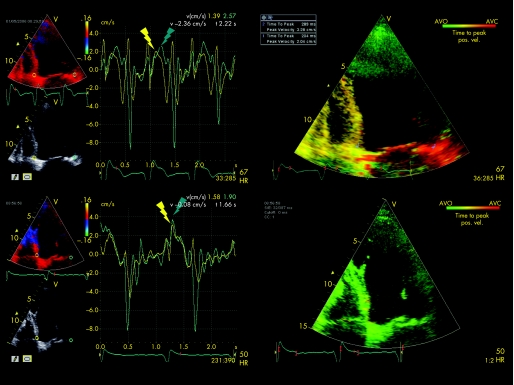
Figure 1 Example of a patient with ischaemic cardiomyopathy who underwent cardiac resynchronisation therapy implantation. The upper left panel shows the pre‐implantation colour‐coded velocity curves derived from the basal septal (yellow) and lateral (green) segments. There is a delay of 90 ms between the septal and lateral peak systolic velocities indicating left ventricular dyssynchrony. The upper right panel shows the tissue synchronisation imaging (TSI) pre‐implantation analysis. The red colour at the basal lateral wall indicates (90) ms delay in mechanical activation. The automatically calculated difference in peak systolic velocities between the septal and lateral wall is 85 ms. The lower left panel shows the post‐implantation velocity curves of the basal septum and lateral wall. No delay remains between the peak systolic velocities of the septum and lateral wall. The lower right panel shows the TSI analysis after implantation. The absence of a red‐coloured region indicates absence of late activation. pos vel, positive velocity.

An official website of the United States government
Here's how you know
Official websites use .gov
A
.gov website belongs to an official
government organization in the United States.
Secure .gov websites use HTTPS
A lock (
) or https:// means you've safely
connected to the .gov website. Share sensitive
information only on official, secure websites.
