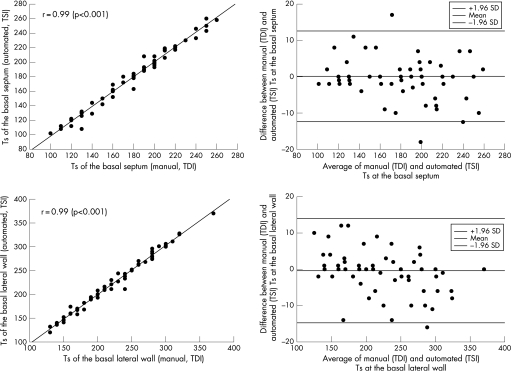
Figure 2 Scatter plot (upper left panel) and Bland–Altman plot (upper right panel) comparing manual (TDI) and automated (TSI) measurements of time‐to‐peak systolic velocities (Ts) at the basal septum. Scatter plot (lower left panel) and Bland–Altman plot (lower right panel) comparing manual (TDI) and automated (TSI) measurements of time‐to‐peak systolic velocities at the basal lateral wall. Pearson's correlations are reported in the left upper corner of the scatter plots.

An official website of the United States government
Here's how you know
Official websites use .gov
A
.gov website belongs to an official
government organization in the United States.
Secure .gov websites use HTTPS
A lock (
) or https:// means you've safely
connected to the .gov website. Share sensitive
information only on official, secure websites.
