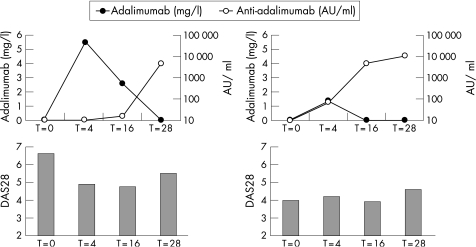
Figure 3 Serum adalimumab concentrations in relationship to anti‐adalimumab antibody concentrations and disease activity score in 28 joints (DAS28). The graphs represent two panels for two individual patients who had high anti‐adalimumab antibodies (>100 AU/ml) during 28 weeks follow‐up. The x‐axis represents time in weeks, and the left y‐axis represents adalimumab concentration in mg/l. The right y‐axis represents the anti‐adalimumab antibody concentration in AU/ml on a log scale. The DAS28 score is presented in bars.

An official website of the United States government
Here's how you know
Official websites use .gov
A
.gov website belongs to an official
government organization in the United States.
Secure .gov websites use HTTPS
A lock (
) or https:// means you've safely
connected to the .gov website. Share sensitive
information only on official, secure websites.
