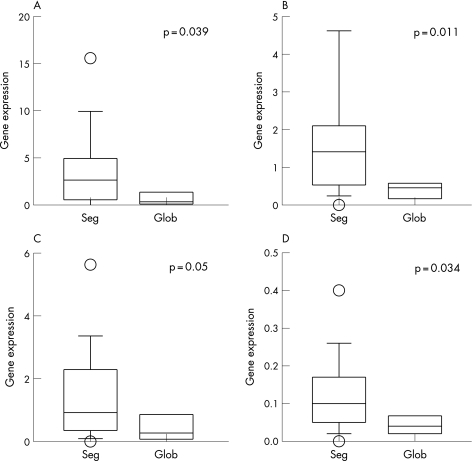
Figure 1 Comparison of gene expression in the glomerulus between patients with segmental versus global glomerular lesions: (A) interferon γ; (B) interleukin (IL)10; (C) IL12 and (D) IL18. Gene expressions are expressed as ratio to the control. Data are presented as the whisker‐box plot and compared by Kruskal–Wallis test. The boxes indicate median, 25 and 75 centile; whisker caps indicate 5 and 95 centile; open circles indicate outliers. seg, segmental lesions; glob, global lesions.

An official website of the United States government
Here's how you know
Official websites use .gov
A
.gov website belongs to an official
government organization in the United States.
Secure .gov websites use HTTPS
A lock (
) or https:// means you've safely
connected to the .gov website. Share sensitive
information only on official, secure websites.
