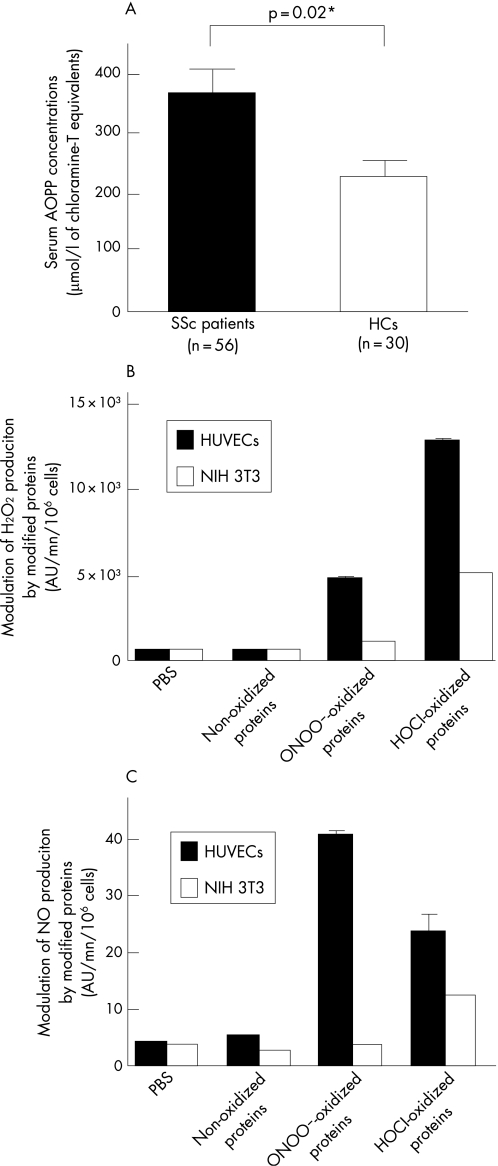
Figure 3 Role of AOPPs in serum‐induced ROS production. (A) Serum AOPP concentration in 56 SSc patients and in 30 healthy controls (HCs). Data are means ±SEM. (B) Production of hydrogen peroxide (H2O2) induced by HOCl‐AOPP, peroxynitrites‐AOPP or non‐oxidized proteins by endothelial cells and fibroblasts. (C) Production of nitric oxide (NO) induced by HOCl‐AOPP or peroxynitrites‐AOPP or non‐oxidized proteins in endothelial cells and fibroblasts. Data are means ±SEM. *Denotes statistical significance.

An official website of the United States government
Here's how you know
Official websites use .gov
A
.gov website belongs to an official
government organization in the United States.
Secure .gov websites use HTTPS
A lock (
) or https:// means you've safely
connected to the .gov website. Share sensitive
information only on official, secure websites.
