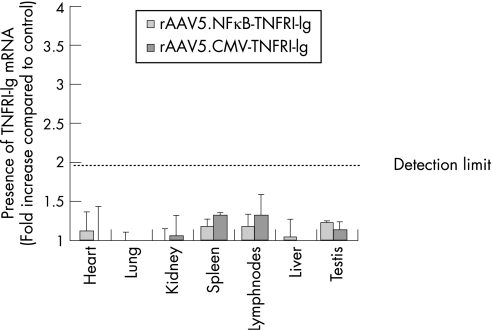
Figure 5 Biodistribution of transgene transcription after intra‐articular injection. To assess the presence of the transgene, heart, lung, kidney, spleen, draining lymph nodes, liver, and testis were excised and homogenised 14 days after intra‐articular injection. RNA was isolated and cDNA was synthesised (n = 5/group). Real‐time PCR was performed using transgene specific primers. The resulting threshold cycle (Ct) values were normalised to glyceraldehyde phosphodehydrogenase (GAPDH) levels and expressed as fold increase compared with control (mean (SEM)).

An official website of the United States government
Here's how you know
Official websites use .gov
A
.gov website belongs to an official
government organization in the United States.
Secure .gov websites use HTTPS
A lock (
) or https:// means you've safely
connected to the .gov website. Share sensitive
information only on official, secure websites.
