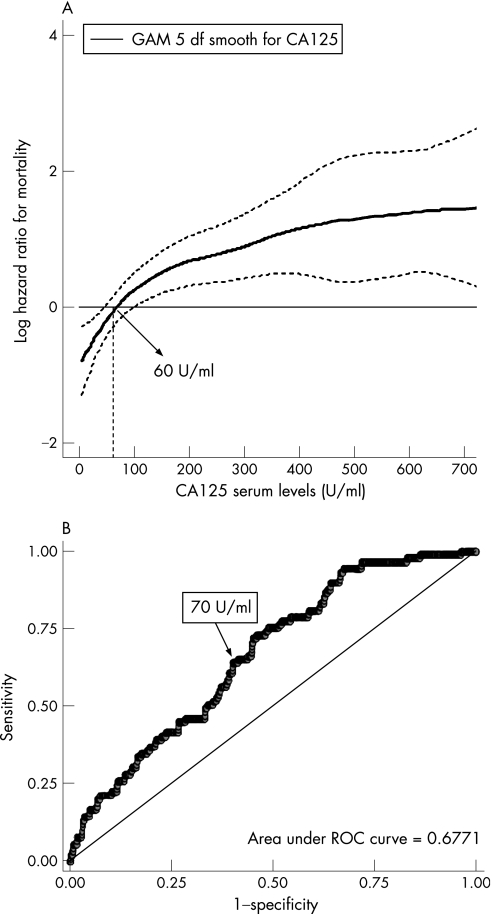
Figure 2 Optimal carbohydrate antigen 125 (CA125) threshold suggested by the generalised additive model (GAM) plot. (A) The functional form in the association between CA125 and the hazard rate for all‐cause mortality. This association is adjusted simultaneously by age, gender, diabetes and their interaction (gender×diabetes), stable New York Heart Association class III/IV, aetiology of valvular heart disease, systolic blood pressure, serum creatinine and haemoglobin. The dotted curves indicate approximate 95% CIs for the smoothed hazard. The arrow indicates the point in the continuum of CA125 that crosses the threshold between high and low risk for mortality (around 60 U/ml). The CA125 distribution was truncated at values >700 U/ml. (B) The receiver operating characteristic (ROC) curve showing the sensitivity and specificity corresponding to each CA125 value, with all‐cause mortality, evaluated up to the 6‐month follow‐up, used as the reference test. The optimal cut‐off point was estimated at 70 U/ml, with an associated sensibility and specificity of 63 and 61, respectively. df, degrees of freedom.

An official website of the United States government
Here's how you know
Official websites use .gov
A
.gov website belongs to an official
government organization in the United States.
Secure .gov websites use HTTPS
A lock (
) or https:// means you've safely
connected to the .gov website. Share sensitive
information only on official, secure websites.
