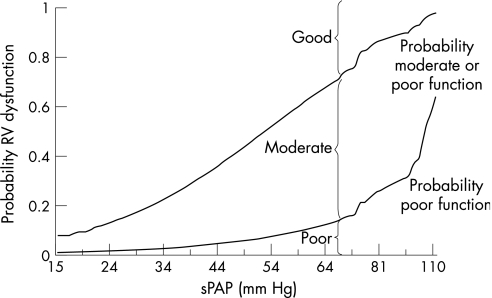
Figure 3 Right ventricular (RV) dysfunction versus systolic pulmonary artery pressure (sPAP) in atrial septal defect (patients with Eisenmenger's syndrome not included). The lines depict the predicted probabilities (the fitted values in a logistic regression model) for RV function as function of pulmonary artery pressure. The upper line represents the probability of having a moderate or poor RV function; the lower line that of having a poor function. Thus, at each level of sPAP, the vertical distances above, in between and below the two lines represent the probabilities of having good, moderate and poor RV function, respectively.

An official website of the United States government
Here's how you know
Official websites use .gov
A
.gov website belongs to an official
government organization in the United States.
Secure .gov websites use HTTPS
A lock (
) or https:// means you've safely
connected to the .gov website. Share sensitive
information only on official, secure websites.
