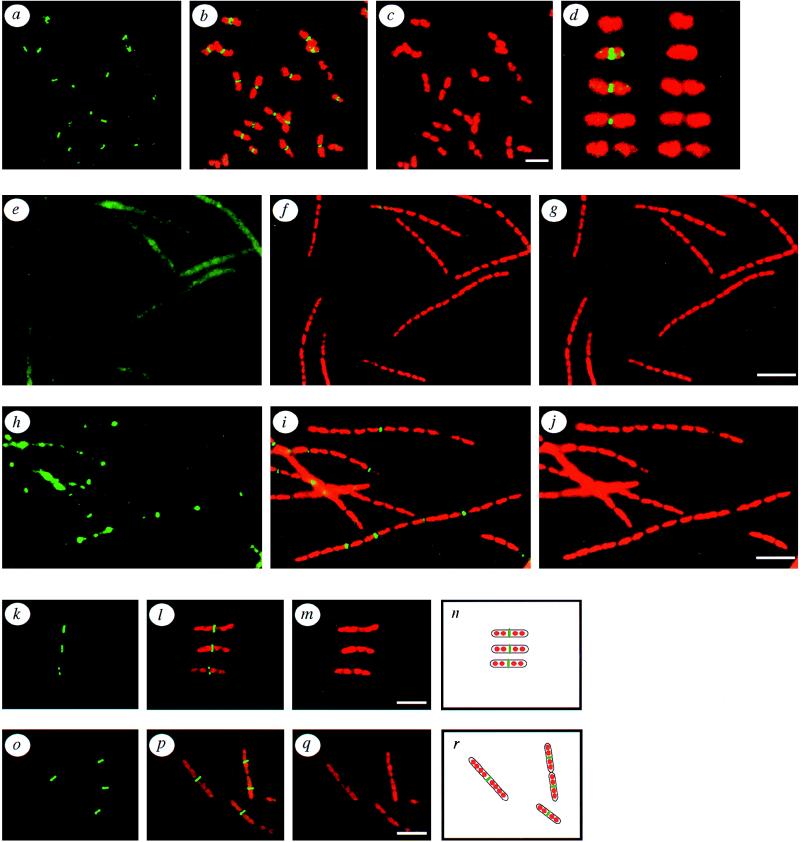
Figure 1.
Subcellular localization of FtsZ in wild-type, ftsZ84, ftsI23, and cephalexin-treated E. coli. (a–c) Localization of FtsZ (green) in exponentially growing wild-type E. coli. (a) FtsZ immunostaining (green) alone. (b) Doubly exposed micrograph of the same field showing both FtsZ (green) and the propidium iodide-stained nucleoids (red). (c) The propidium iodide-stained nucleoids alone. (d) A series of cells depicting FtsZ assembly states during the E. coli division cycle, starting from a newborn cell lacking an FtsZ ring (top) and ending with a fully constricted but as yet unseparated pair of newborn cells. The left column of cells show both FtsZ protein (green) and the nucleoids (red), while the right column of cells show the nucleoids only (red). (e–g) Localization of FtsZ in an ftsZ84 mutant at the nonpermissive temperature. (e) FtsZ staining (green) alone. (f) A double exposure of the same field of cells showing FtsZ (green) and the nucleoids (red). (g) Propidium iodine-stained nucleoids. (h–j) Localization of FtsZ in the ftsI23 mutant at the nonpermissive temperature. (h) FtsZ alone (green). (i) FtsZ (green) and the nucleoids (red). (j) Nucleoids alone (red). (k–m) Localization of FtsZ in cells treated with cephalexin for two generatations. (k) FtsZ staining (green) alone. (l) FtsZ (green) and the nucleoids (red). (m) Nucleoids alone (red). (n) Diagram of the cells in k–m, showing the inferred outlines of the cells (black), and the positions of the nucleoids (red), and the FtsZ rings (green). (o–q) A different field of cells from the same experiment as in k–m, showing additional patterns of FtsZ localization in filaments after two generations of growth in the presence of cephalexin. (o) FtsZ (green) alone. (p) A double exposure showing both FtsZ (green) and the nucleoids (red). (q) Nucleoids alone (red). (r) A diagram of the cells in o–q, showing the inferred outlines of the cells (black), and the positions of the nucleoids (red) and the FtsZ rings (green). (Bar = 5 μm.)

