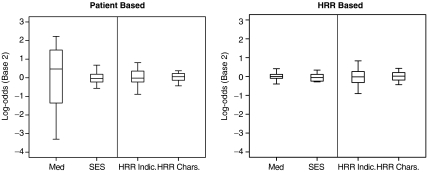
Figure 1.
The Degree to Which Characteristics Explain Chemotherapy Use
Parallel Boxplots of the Θi is and πi's. The ratio of ΣΘ2 and Σπ2 forms ω and  for the patient- and hospital referral region [HRR]-based analyses, respectively. The boxplots are of the 25th and 75th percentile, with the whiskers at 5 percent and 95 percent. The first three boxplots come from Model [3], and the HRR characteristics (HRR Chars.) boxplot comes from Model [4]. SES, socioeconomic status.

