
Fig. 4.
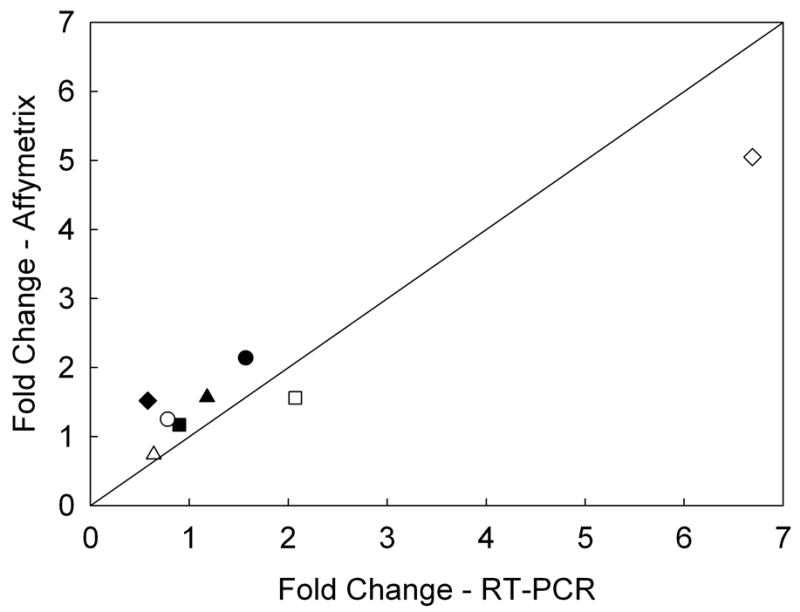
Comparison of changes in gene expression after cells were exposed to VAN or CIN for 4 h among selected genes as measured by microarray versus RT-PCR. Filled symbols indicate fold changes with VAN treatment, and open symbols indicate fold changes with CIN treatment (r2 = 0.97, p = 0.0001), ◆ = HMOX1, ⎵ = DDIT4, ● = CLK4, ■ = GCLM. The solid line indicates identical fold changes from both microarray and RT-PCR results.