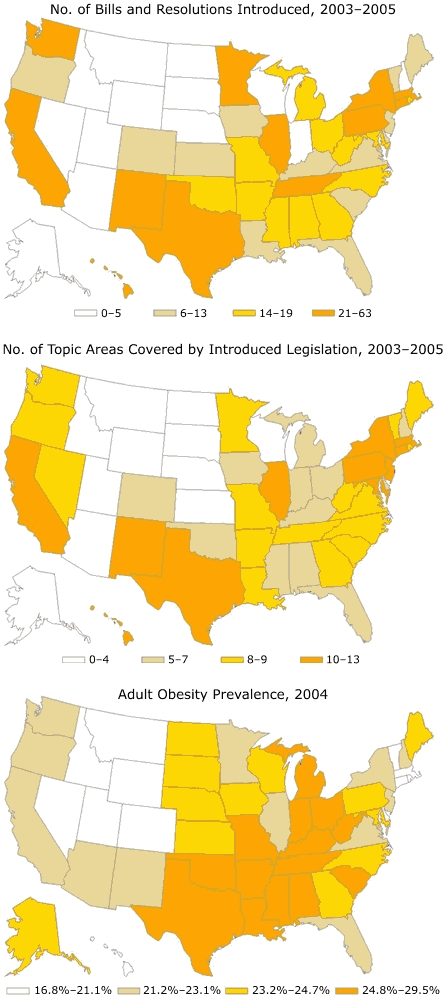
Figure 1.
Number of bills and resolutions introduced and number of topic areas covered by introduced legislation, 2003–2005, and prevalence of adult obesity, 2004, United States.
Bills and Resolution Introduced, 2003–2005
Topic Areas Covered by Introduced Legislation, 2003–2005
| No. Topic Areas Covered | No. States |
|---|---|
| 0-4 | 11 |
| 5-7 | 12 |
| 8-9 | 16 |
| 10-13 | 11 |
Adult Obesity Prevalence, 2004
| Percent Obese | No. States |
|---|---|
| 16.8-21.1 | 12 |
| 21.2-23.1 | 12 |
| 23.2-24.7 | 12 |
| 24.8-29.5 | 14 |

