
Figure.
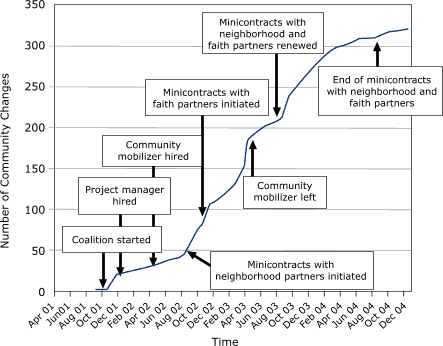
Cumulative number of community changes facilitated by the Kansas City-Chronic Disease Coalition from its inception through December 2004 (N = 321).
Official websites use .gov
A
.gov website belongs to an official
government organization in the United States.
Secure .gov websites use HTTPS
A lock (
) or https:// means you've safely
connected to the .gov website. Share sensitive
information only on official, secure websites.
Cumulative number of community changes facilitated by the Kansas City-Chronic Disease Coalition from its inception through December 2004 (N = 321).