
Figure 4.
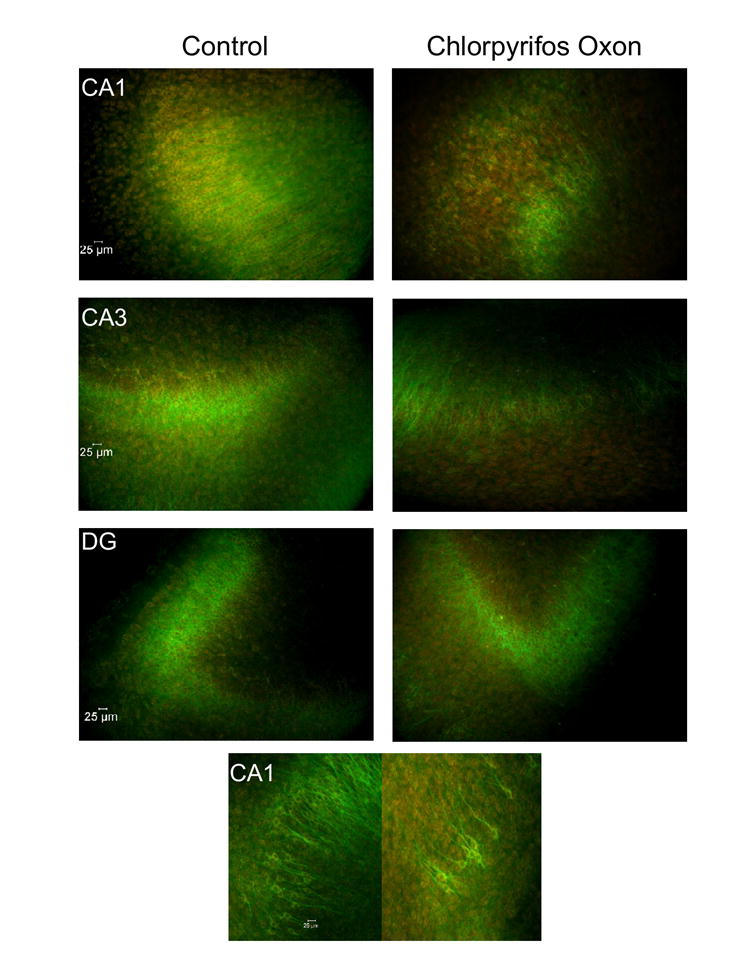
Representative images of MAP-2 immunoreactivity (FITC) in hippocampal cultures exposed to CPO at 20X (top, in all regions) and 40X (bottom, in CA1). MAP-2 images are merged with images of propidium iodide fluorescence (red), a marker of somatic injury.