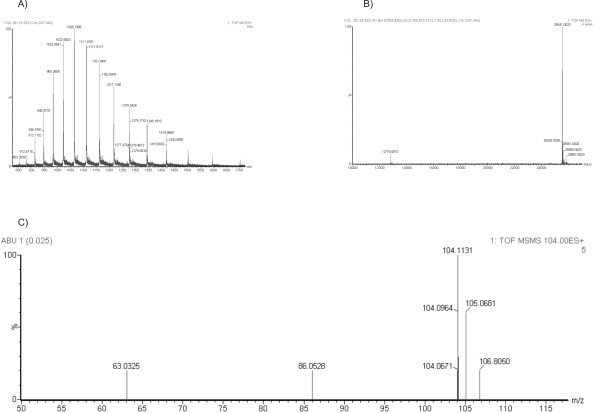
Figure 5.
CGL mass spectrometry analysis. (A) Mass spectrometry analysis of CGL reveals peaks of ions with charge from +18 (m/z = 1419.8669) to + 28 (m/z = 913.1152). (B) Deconvolution of CGL spectrum, showing the double-charged ion (m/z = 12770.0010) and the mono-charged ion (m/z = 25541.0020) which represents the exact mass of the protein. (C) The Abu signature is represented by the peak with m/z (+H) = 104.1131 ± 0.1 M. The presence of Abu in the CGL structure was confirmed by MS/MS analysis. The spectrum reveals an Abu fragmentation ion displaying m/z = 86.05 ± 0.1, this mass referred to Abu molecular mass with a common loss of a water group (~18 Da).

